
Testing Distributed Systems
Why Integration Tests Matter More Than Unit Tests

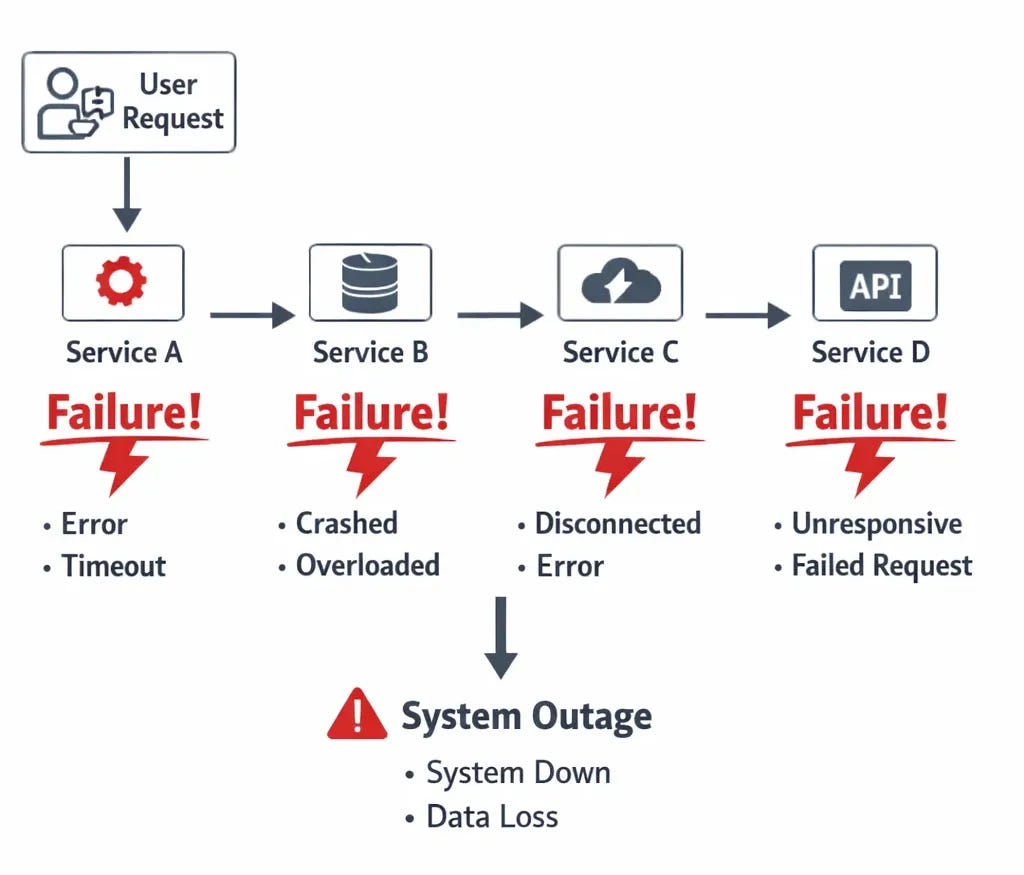
The first time I handled a production incident in a microservices architecture, I made the mistake of immediately diving into logs from the service that was throwing errors. I spent twenty minutes reading through stack traces and error messages trying to understand what was going wrong, only to eventually discover that the actual problem was three services upstream in a completely different part of the system. The service I was looking at was failing because it wasn’t receiving the data it expected, but the root cause was a configuration change in an entirely different service that had been deployed hours earlier. That incident taught me that debugging distributed systems requires a fundamentally different approach than debugging monolithic applications, because the symptoms you see are often far removed from the actual cause.
Why Traditional Debugging Breaks Down in Distributed Systems
When you’re debugging a monolithic application, you can usually follow the execution path linearly through your code from the entry point to where the error occurred. You have a single log file or log stream to look through, a single process to attach a debugger to, and a clear understanding of the state of your application at any given moment. The complexity is vertical, meaning you’re dealing with the depth of your code stack rather than the breadth of your architecture, and traditional debugging tools like debuggers and single log files work reasonably well for this model.
In a distributed system, that linear path disappears because a single request might touch five or ten different services, each running in its own container or virtual machine with its own logs and its own state. The complexity becomes horizontal rather than vertical, and the traditional debugging approach of starting at the error and working backwards through the code doesn’t work anymore because the error you’re seeing might be the last service in a chain that started failing because the first service in that chain made a bad assumption or received corrupted data. You end up chasing symptoms rather than causes unless you have the right observability infrastructure in place to understand how requests flow through your entire system.
The Three Pillars: Logs, Metrics, and Traces
The industry has largely settled on three fundamental types of observability data for distributed systems: logs, metrics, and traces. Logs are the discrete event records that tell you what happened at specific moments in time, like “user authentication failed” or “database connection timed out.” Metrics are the aggregated measurements that tell you about the overall health and performance of your system, like request rates, error rates, CPU usage, and latency percentiles. Traces are the records of how a single request flowed through multiple services, showing you the path a request took and how long each step took along the way.
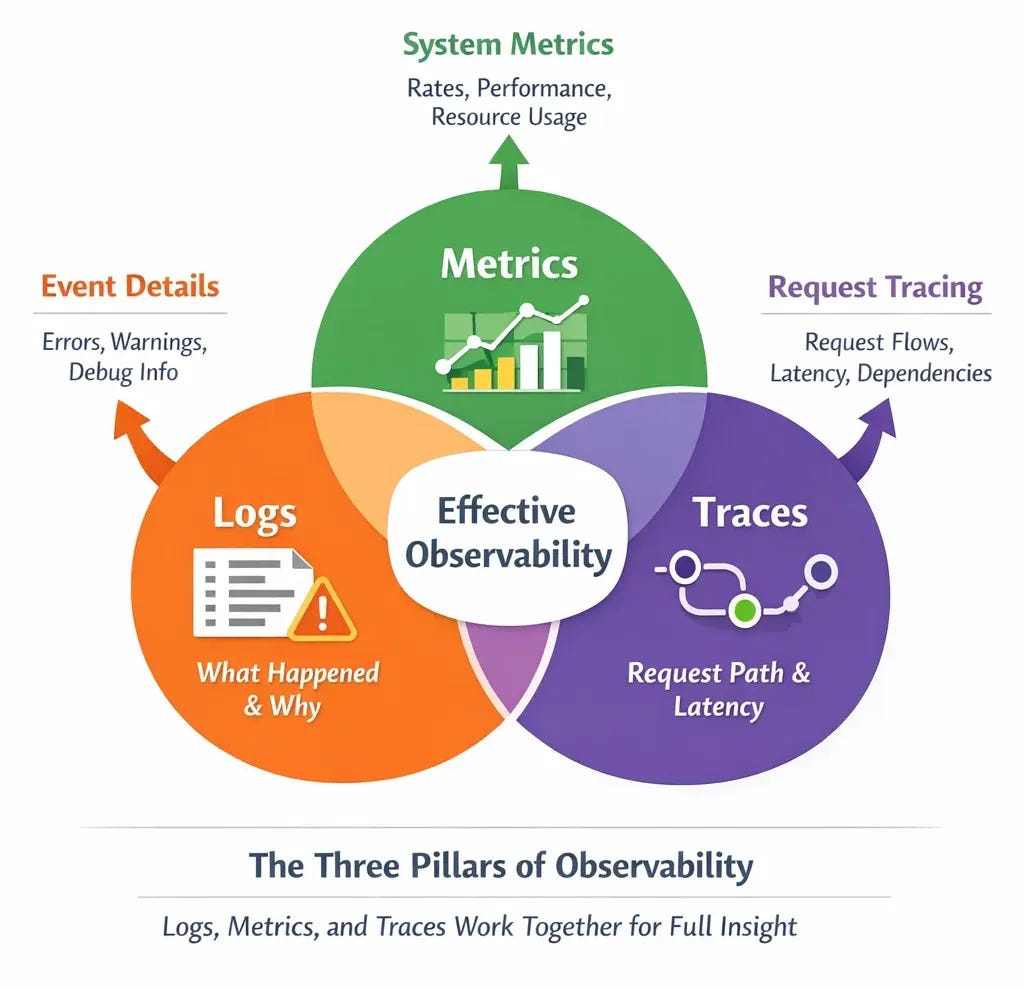
The key insight is that you need all three of these to effectively debug production issues in distributed systems because each type of data answers different questions. Logs tell you what specific things happened and why, metrics tell you whether things are generally healthy or degrading, and traces tell you where in a complex request path things went wrong. When I’m investigating an incident, I typically start with metrics to understand the scope and pattern of the problem, use traces to identify which service or integration point is causing issues, and then dig into logs from that specific service to understand the root cause.
Structured Logging: Making Logs Actually Useful
One of the biggest mistakes I made early in my career was writing logs as human-readable strings without any structure, like “Error processing request for user John” or “Database query took longer than expected.” These logs are fine if you’re manually reading through a small number of entries, but they become nearly useless when you’re trying to debug a production incident where you might have millions of log entries and need to quickly filter down to the relevant ones. The problem is that unstructured logs are difficult to query programmatically because you can’t easily extract the important fields like user ID, request ID, error type, or duration without resorting to complex regular expressions.
Structured logging means writing logs as JSON objects or key-value pairs that can be easily parsed and queried by log aggregation tools like CloudWatch Logs Insights, Datadog, or Elasticsearch. Instead of logging “Error processing request for user John”, you log something like
{"level": "error", "message": "request processing failed", "user_id": "12345", "request_id": "abc-def", "error_type": "database_timeout", "duration_ms": 5000}. This structure means you can instantly query for all errors of a specific type, all requests from a specific user, all requests that took longer than a certain duration, or any combination of these filters, which dramatically reduces the time it takes to find the relevant logs during an incident.
import logging
import time

logging.basicConfig(level=logging.INFO)

def process_request(user_name):
    start = time.time()
    try:
        # Simulate a database timeout
        raise TimeoutError("DB timeout")
    except Exception as e:
        duration_ms = int((time.time() - start) * 1000)
        logging.error(
            f"Error processing request for user {user_name}. "
            f"Error: {str(e)}. "
            f"Took {duration_ms}ms"
        )

process_request("John")
The other critical piece of structured logging is including correlation IDs or request IDs that flow through your entire system so you can trace a single request across multiple services. When a request enters your system at the API gateway, you generate a unique ID and include that ID in every log entry related to that request across every service it touches. This means that when you’re debugging why a specific user’s request failed, you can search for that request ID and see the complete journey of that request through your system, including which services it hit, what operations each service performed, and where it ultimately failed. Without correlation IDs, you’re left trying to piece together which log entries across different services are related to the same request, which is often impossible in a high-traffic system.
Distributed Tracing: Following Requests Through the Maze
While structured logging with correlation IDs gives you the ability to trace requests manually by searching for request IDs in logs, distributed tracing takes this concept much further by automatically tracking the path of requests through your system and visualizing that path in tools like Jaeger, Zipkin, or AWS X-Ray. A distributed trace shows you not just which services a request touched but also how long it spent in each service, what operations each service performed, and where the bottlenecks or failures occurred. This visualization makes it dramatically faster to identify which part of your system is causing problems during an incident.
The way distributed tracing works is that each service in your system instruments its code to record spans, which are records of work being done like “database query” or “call to external API.” These spans are organized hierarchically to show parent-child relationships, so you can see that a request to your API gateway triggered a call to your authentication service, which triggered a database query, which triggered a cache lookup. The entire tree of spans for a single request is called a trace, and distributed tracing systems collect these traces and allow you to query them to find slow requests, failed requests, or requests that hit specific services.
What makes distributed tracing so powerful for debugging is that it immediately shows you where time is being spent in your system without requiring you to manually piece together information from multiple log files. When users start complaining about slow response times, you can pull up traces for recent requests and instantly see whether the slowdown is in your database queries, in calls to external APIs, in CPU-intensive processing, or in network latency between services. This cuts debugging time from hours of log analysis down to minutes of trace visualization, and it’s especially valuable when the problem is something like a service that’s occasionally timing out but not throwing explicit errors that would show up in logs.
Metrics and Alerting: Knowing When Things Go Wrong
Logs and traces are essential for understanding what happened after an incident occurs, but metrics are what tell you that an incident is occurring in the first place. By collecting and monitoring metrics like request rate, error rate, latency percentiles, CPU usage, memory usage, and database connection pool utilization, you can detect problems often before users start complaining and sometimes even before any errors occur. A monitoring tool like Datadog, Prometheus, or CloudWatch can alert you when metrics cross certain thresholds, like when error rate exceeds 1% or when 95th percentile latency goes above 500ms.
The key to effective alerting is to focus on metrics that actually indicate user-facing problems rather than alerting on every internal error or warning that might occur. I’ve seen teams that alert on every exception thrown or every failed health check, which leads to alert fatigue where people start ignoring alerts because most of them turn out to be false alarms or transient issues that self-resolve. A better approach is to alert on symptoms rather than causes, meaning you alert when users are experiencing slow response times or high error rates rather than when a specific service is throwing a specific type of exception. If the exception is causing a user-facing problem, it will show up in your symptom-based alerts, and if it’s not causing a user-facing problem, you probably don’t need to wake someone up at 2 AM to fix it.
The metrics I’ve found most valuable for alerting in distributed systems are request error rate (what percentage of requests are failing), request latency at various percentiles (how long requests are taking for the slowest users), and request throughput (how many requests per second the system is handling). These three metrics together give you a good picture of whether your system is healthy from a user perspective, and they work across different types of services whether you’re running APIs, message processors, or background jobs. When any of these metrics deviates significantly from normal patterns, it’s usually a sign that something needs attention even if you don’t yet know what the root cause is.
Building a Debugging Workflow That Actually Works Under Pressure
When you get paged at 2 AM, the last thing you want to be doing is figuring out which tool to use or where to find the information you need. Having a well-defined debugging workflow that you practice during normal working hours means you can operate effectively even when you’re tired and stressed during an actual incident. The workflow I’ve developed over years of responding to production incidents starts with checking high-level metrics to understand the scope of the problem, then uses distributed tracing to identify which service or integration point is involved, and finally digs into structured logs from that specific service to understand the root cause.
The first step is always to look at your monitoring dashboard to understand whether this is affecting all users or just some users, whether it’s a gradual degradation or a sudden failure, and which parts of your system are showing abnormal metrics. This context is crucial because it tells you how urgent the incident is and gives you clues about where to look next. If error rate suddenly jumped from 0.1% to 25% exactly five minutes ago, you probably want to check what was deployed five minutes ago. If error rate has been gradually climbing over the last hour, you’re probably looking at a resource exhaustion problem rather than a bad deployment.
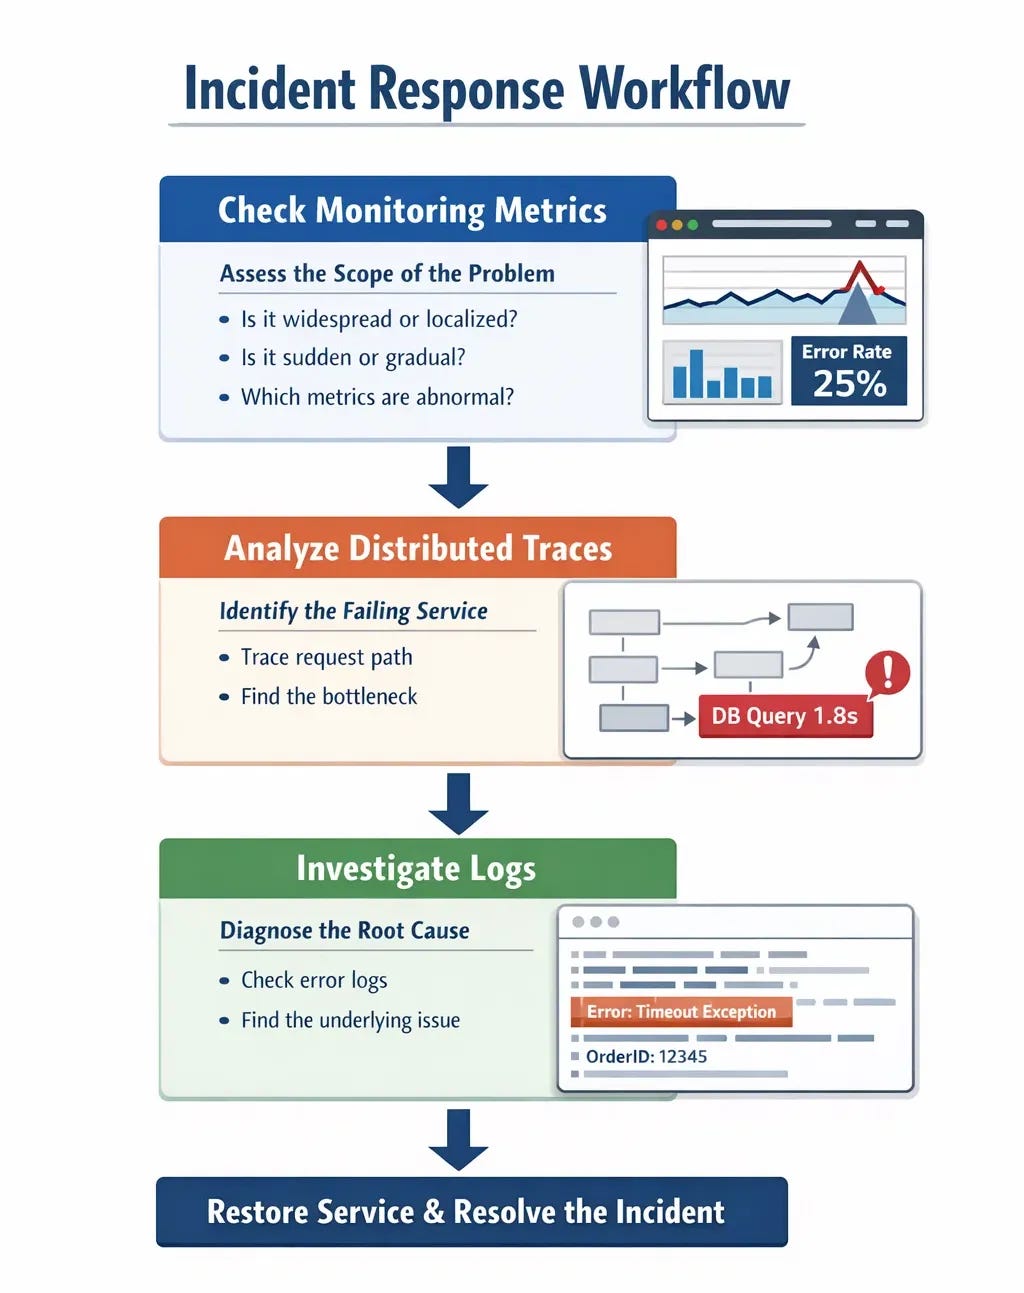
Once you understand the scope, you use distributed tracing to find a few example traces of failed or slow requests and see which service in the chain is causing the problem. Maybe you see that 95% of traces are spending excessive time in the database query span, or maybe you see that traces are failing when they try to call an external payment API. This narrows down your investigation from “something is wrong somewhere in our system” to “something is wrong with this specific operation in this specific service”, which is a much more manageable debugging target.
Finally, you dig into the structured logs for that specific service and that specific operation to understand why it’s failing or why it’s slow. Because you’re using structured logging with correlation IDs, you can quickly filter down to just the logs related to the failing requests rather than searching through millions of unrelated log entries. The combination of metrics for detection, traces for localization, and logs for diagnosis creates a debugging workflow that’s both fast and systematic, which is essential when you’re trying to restore service during a production incident.
The Tools You’ll Actually Use
While there are dozens of observability tools available, most teams end up using a fairly standard stack that includes a log aggregation tool, a metrics monitoring tool, and optionally a distributed tracing tool. For log aggregation, CloudWatch Logs works well if you’re on AWS, Datadog is popular for teams that want a unified platform for logs, metrics, and traces, and Elasticsearch with Kibana (often called the ELK stack when combined with Logstash) is a powerful open source option though it requires more operational overhead.
For metrics monitoring, Prometheus has become the de facto standard for Kubernetes environments and is widely used elsewhere as well, while CloudWatch again works well for AWS-centric architectures and Datadog provides a more opinionated and polished experience at the cost of being a paid service. The key is to pick tools that integrate well with your existing infrastructure and that your team will actually use during incidents rather than the tools with the most features or the most impressive demos.
For distributed tracing, OpenTelemetry has emerged as the vendor-neutral standard for instrumenting your code, and it can export traces to various backends like Jaeger, Zipkin, AWS X-Ray, or Datadog APM. The advantage of using OpenTelemetry is that you can instrument your code once and then switch between different tracing backends without having to reinstrument everything. That said, distributed tracing requires more setup than logs or metrics and not every team finds it worth the investment, especially if you already have good structured logging with correlation IDs.
Key Takeaways for Debugging Distributed Systems
The most important lesson I can share about debugging distributed systems is that you need to invest in observability infrastructure before you need it, because trying to add proper logging or tracing during an active incident is too late. This means implementing structured logging with correlation IDs from the start, setting up metrics collection and alerting on symptoms rather than causes, and at least considering distributed tracing if your system is complex enough that following request paths through logs is becoming difficult.
Start with structured logging and metrics since these provide the most value for the least investment, and make sure every service in your system logs in a consistent format with consistent field names so you can search across all services effectively. Add correlation IDs that flow through your entire request path so you can trace individual requests across services using just log queries. Set up alerting on user-facing symptoms like error rate and latency rather than internal implementation details, and practice your debugging workflow during normal working hours so you’re not learning your tools during an incident.
Consider adding distributed tracing once your system reaches a complexity where manually tracing requests through logs becomes time-consuming, but don’t feel like you need to implement every observability tool at once. Many teams operate successfully with just structured logging and metrics, and you can always add more sophisticated tooling later as your needs grow. The goal is to be able to answer three critical questions quickly during an incident: what is failing, where in the system is it failing, and why is it failing. As long as your observability infrastructure lets you answer these questions efficiently, you’re well-positioned to handle production incidents effectively.
How does your team handle production debugging?
What observability tools have you found most valuable, and what lessons have you learned from debugging distributed systems under pressure?
Share your experiences in the comments.
With Love and DevOps,
Maxine
Speaking of production readiness if you’re working with LLM systems and want to move beyond toy examples to building production-grade applications, I wrote a comprehensive book that covers everything from prompt engineering to deployment strategies.
It’s based on real production experience.
Last Updated: January 2026